Carry is the price of time, leverage and protection.
A carry trade does not begin with a view on whether Bitcoin will rise or fall. It begins with a market imbalance: one participant wants leverage, another wants liquidity, another wants protection against volatility, and another is willing to hold the opposite side under defined conditions.
CarryLane studies the payment created by that imbalance.
Direction is a guess.
Guessing is expensive.
Most people enter crypto the same way: buy something, hope it goes up. Every cycle repeats the lesson — the majority of directional traders lose money, not because they are careless, but because predicting price is the hardest job in finance.
Meanwhile a quieter business runs underneath every exchange: the market constantly pays participants who keep it balanced — who take the other side, hold the hedge, carry the position. That payment does not care whether price goes up or down.
We don’t sell predictions. We collect the payment for balance.
A payment lands
every eight hours.
Perpetual futures — the instrument most of crypto trades — have a built-in mechanism called the funding rate. Every eight hours, one side of the market pays the other to keep prices anchored. When the crowd leans long, longs pay shorts. Simply for holding the balanced side, you get paid.
The idea behind CarryLane came from watching those payments land — through rallies, crashes and boring weekends alike. Price moved unpredictably; the payments kept arriving on schedule.
Traders call this family of income «carry». Hence the name — and the lane.
Three engines. Zero directional bets.
Every CarryLane position is built the same way: buy one thing, hedge it with its mirror, and hold the pair while the market pays for the difference. If Bitcoin drops 20 %, the long side loses what the short side gains — price risk ≈ 0 — and the payment keeps flowing.
Funding capture
Hold the asset, short its perpetual. The crowd leaning long pays that position every eight hours — the classic carry trade, crypto edition.
→ pays in any market direction
Basis capture
Futures trade above spot most of the year. Buy spot, sell the future, and the gap closes toward you as expiry approaches — a convergence you can schedule.
→ converges on a calendar, not a hope
Volatility premium
Options buyers pay for insurance. The desk sells that insurance in strictly hedged structures and keeps the premium as it decays.
→ premium decays daily in our favour
Carry never sleeps.
Neither does the engine.
Funding pays every eight hours, on hundreds of pairs, across a dozen venues. No human desk can watch all of it — so ours is automated. The engine scans spreads around the clock, enters only when the payment clears costs with margin to spare, and exits the moment the spread compresses.
Rules are hard-coded and boring on purpose: hedge first, size by risk limit, never carry an unpaired position overnight. Boring is what lets the lane run 24/7.
00 / THE ONLY EQUATION THAT MATTERS
Eight lines.
Everything else is detail.
The carry component may be positive, flat or negative.
Point at any term — in the line or in the list — to read it. Click to open its chapter.
Carry±Revaluation−Fees−Financing−Slippage−Custody−Platform=Net result
IN PLAIN WORDSwhat comes in ± how it revalues − what it costs to hold and to run = what is left
Before a strategy earns carry, it has to survive price movement.
The simplest carry construction is called a cash-and-carry position. The strategy buys an asset on the spot market and sells the same amount through a futures or perpetual contract. The first line of the formula is the spot leg; the second is the short futures leg.
If spot and futures move together, one leg can offset part of the other. The remaining result depends on the change in the spread, the funding payments, fees and the cost of keeping both legs open. The strategy is not "risk-free": Basisₜ can widen, liquidity can decline, collateral can become insufficient, and either leg may be expensive to close.
02 / PERPETUAL FUNDING
Perpetuals pay traders to keep price close to spot.
A perpetual future has no maturity date. Exchanges therefore use funding payments to encourage the perpetual price to remain close to the spot price. When perpetual demand is strongly long, long traders may pay short traders. When demand is strongly short, the payment can reverse.
A positive funding rate is not automatically profitable — the strategy must first pass the gate. If the answer is no, the position should not be opened merely because the headline funding rate looks attractive.
† Funding interval — commonly, not universally, every 8h
† Notional — value controlled; can exceed collateral under leverage
† Rebalancing — re-sizing a hedge leg that drifted
One funding payment
Funding Paymentᵢ = Position Notionalᵢ × Funding Rateᵢ
Position Notionalᵢ = Qᵢ × Perpetual Priceᵢ Funding Rateᵢ = exchange-set rate for interval i
Q = asset quantity; i = interval. For a short: positive funding is received, negative funding is paid.
Sum the payments
Gross Funding Carry = Σ₍ᵢ₌₁→ₙ₎ (Short Notionalᵢ × Funding Rateᵢ)
Σ adds the payments across intervals. Position size and funding rate may change at each interval.
Inside the limits.
Healthy collateral buffer.
Separate risk check. Funding is calculated below.
Longs pay your short position.
+1.00%Payment / interval+$5,250
Gross / day · 3 intervals+$15,750
Net / day · after $150 costs+$15,600
Expected Funding Income > All Expected Costs + Risk Buffer?
Funding gate only — ADL, collateral and other risk checks must also pass.
Net Funding Carry
+$15,600 / day= Σ Funding Received − Σ Funding Paid
− Spot Trading Fees − Perpetual Trading Fees − Borrowing Cost, if any − Hedge Rebalancing Cost − Slippage
Risk buffer is an entry hurdle, not an expense deducted from net carry.
Example: trading $60 + borrowing $40 + rebalancing $30 + slippage $20 = $150/day; plus $400 risk buffer. Linear perpetual, fixed notional and rate; 3 intervals/day. No live market data.
A futures premium can be a price for time.
A dated futures contract may trade above spot — that difference is called basis. Buy spot, sell the more expensive future: at expiry the futures price converges toward the settlement price of the underlying. Convergence is a tendency, not a guarantee — before expiry the spread may widen, and an attractive entry can still show an unrealised loss.
A perpetual position holds two layers at once.
Perpetual carry is more complex than dated-futures carry because there is no fixed maturity. The position can earn or pay funding while the difference between spot and perpetual price changes over time. The strategy does not assume funding remains positive — it monitors the spread as a whole.
If funding reverses, basis widens or the cost of keeping the hedge open rises, the position may no longer meet the mandate criteria. CarryLane's role is not to "defend" every trade. It is to reassess whether the trade still belongs inside the strategy.
The same asset, priced differently by different venues.
Two venues, different funding rates, collateral rules and liquidity. Long on one, short on the other: exposure is paired, and the gross result comes from the difference in funding and relative pricing.
† Collateral fragmentation — margin scattered across venues in a stressed market · † Relative value — trading a relationship, not a direction
Premium is the price of protection.
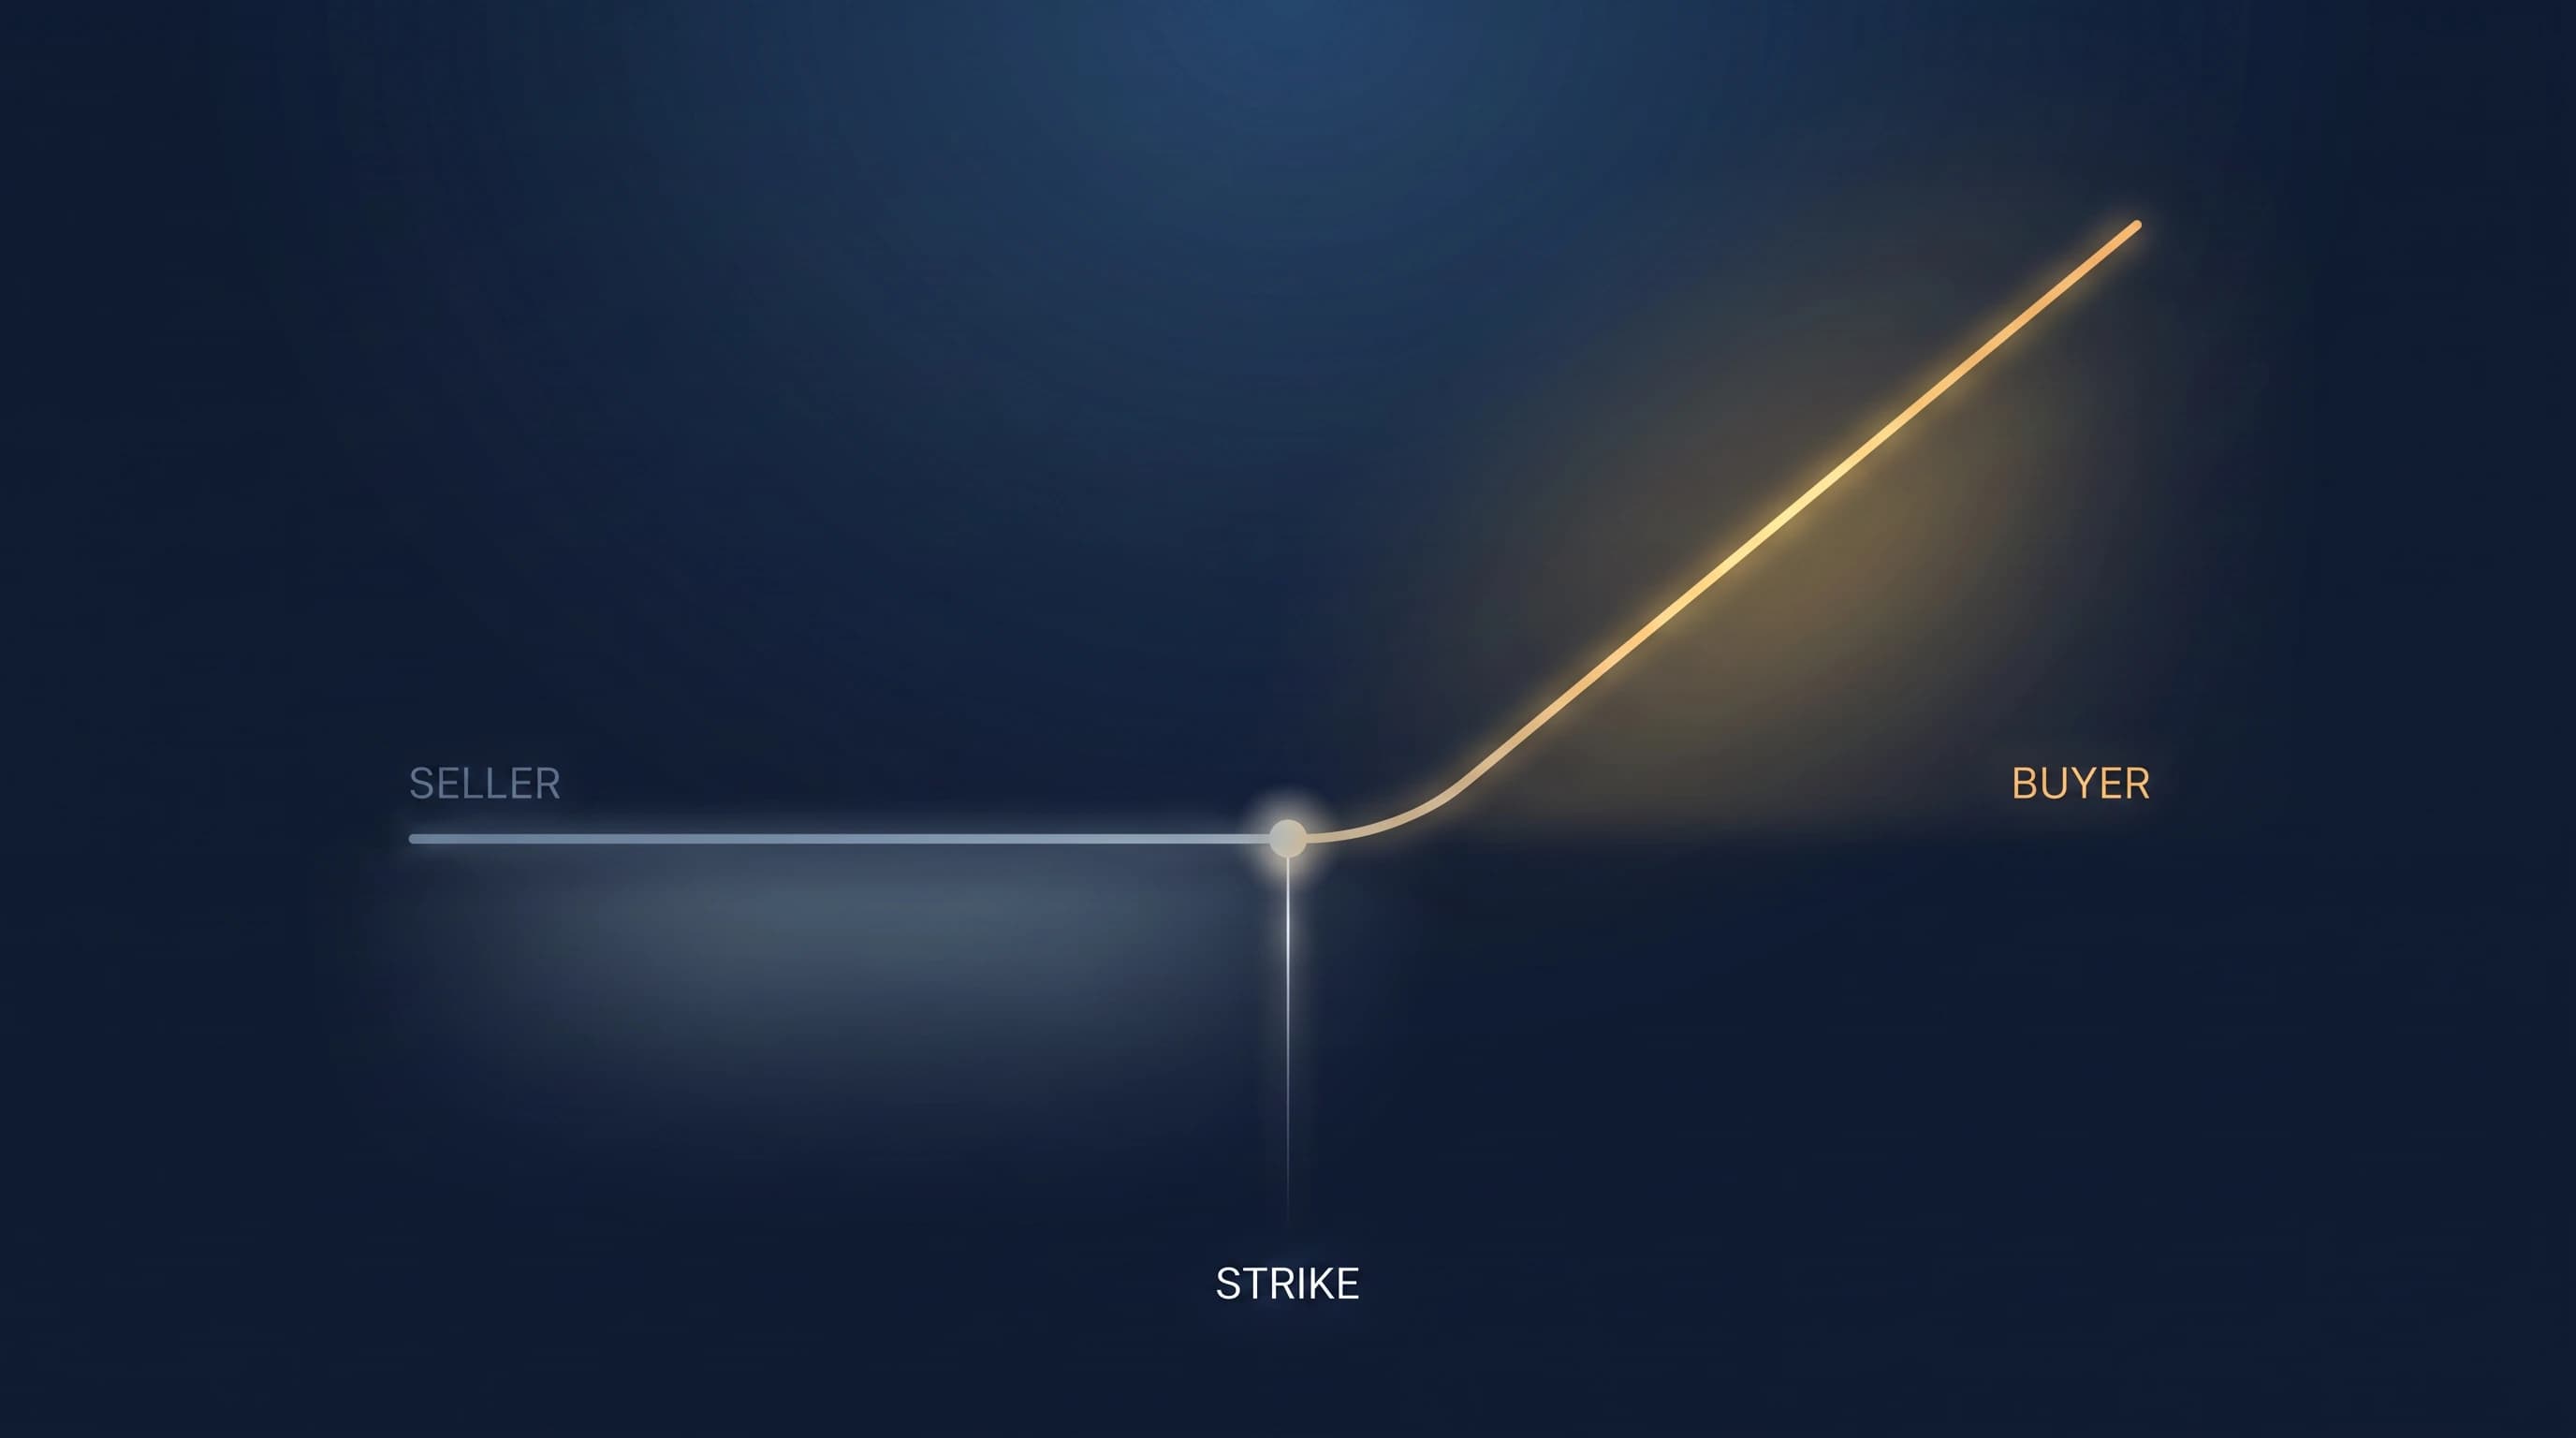
Options give the buyer a right, but not an obligation, to buy or sell an asset at a predefined strike price. The buyer pays an option premium. The seller receives that premium and accepts the risk defined by the option structure. Drag Sᵀ across the strike — watch the seller's premium erode into payoff.
A written option layer can earn time decay and premium, but it can lose rapidly during a sharp price move or a volatility expansion. That is why the layer runs under limits of its own, and why Carry Option — the strategy that carries it — is rated a notch above the plain carry book rather than sold as an extension of it.
The option layer, drawn.
The card on the slide before this one is frozen at a single price. This one is not. Move the market to wherever it finishes the cycle and watch the premium the seller kept erode into the payoff the structure owes.
The desk never sells an option on its own. It sells the strikes 12 % either side of where the cycle opened and buys the wings back at 20 %, so the loss stops growing at the wing instead of running on. That is what turns an open-ended obligation into a number that can be written down before the trade exists.
- Premium received
- +$5,850
- Structure settles
- $0
- Seller P&L
- +$5,850
Worst case by construction: the payoff stops growing at $23,400 — 4× the premium — because the wings were bought and collateralised on day one.
Illustrative. A proposed structure settled at expiry, on the premium the card above prints. Not a quote, not a forecast and not a price: the only input is where the market finished.
The strategy this layer belongs toCarry Option ↗
Carry is only useful while the position stays liquid, funded, measurable.
Every strategy should enter a position only after checking liquidity, expected spread, fees, collateral, concentration and liquidation distance.
When the buffer approaches a defined minimum, the strategy may reduce position size, add permitted collateral or close exposure. The correct action is determined by risk rules — not by the desire to preserve a target return.
The only number that matters comes after all disclosed costs.
Every CarryLane position separates market result from company revenue. Gross Strategy Result = Funding P&L + Basis P&L + Volatility P&L + Realised Hedge P&L; the investor's number is what remains after exchange fees, borrowing and funding costs, slippage, custody and network costs, and the share CarryLane keeps above the target the contract was sold at. Nothing is deducted from the investor's side of it.
CarryLane does not ask the investor to trust a headline percentage — it shows the construction, the costs, the controls and the final net result. The client should see:
The spread is already moving.
Your move is to take your place in Carry.
Carry is a family of strategies built around market structure. Its value depends on the premium available, the quality of execution, the cost of the hedge and the discipline of risk control.